Modelling and visualisation
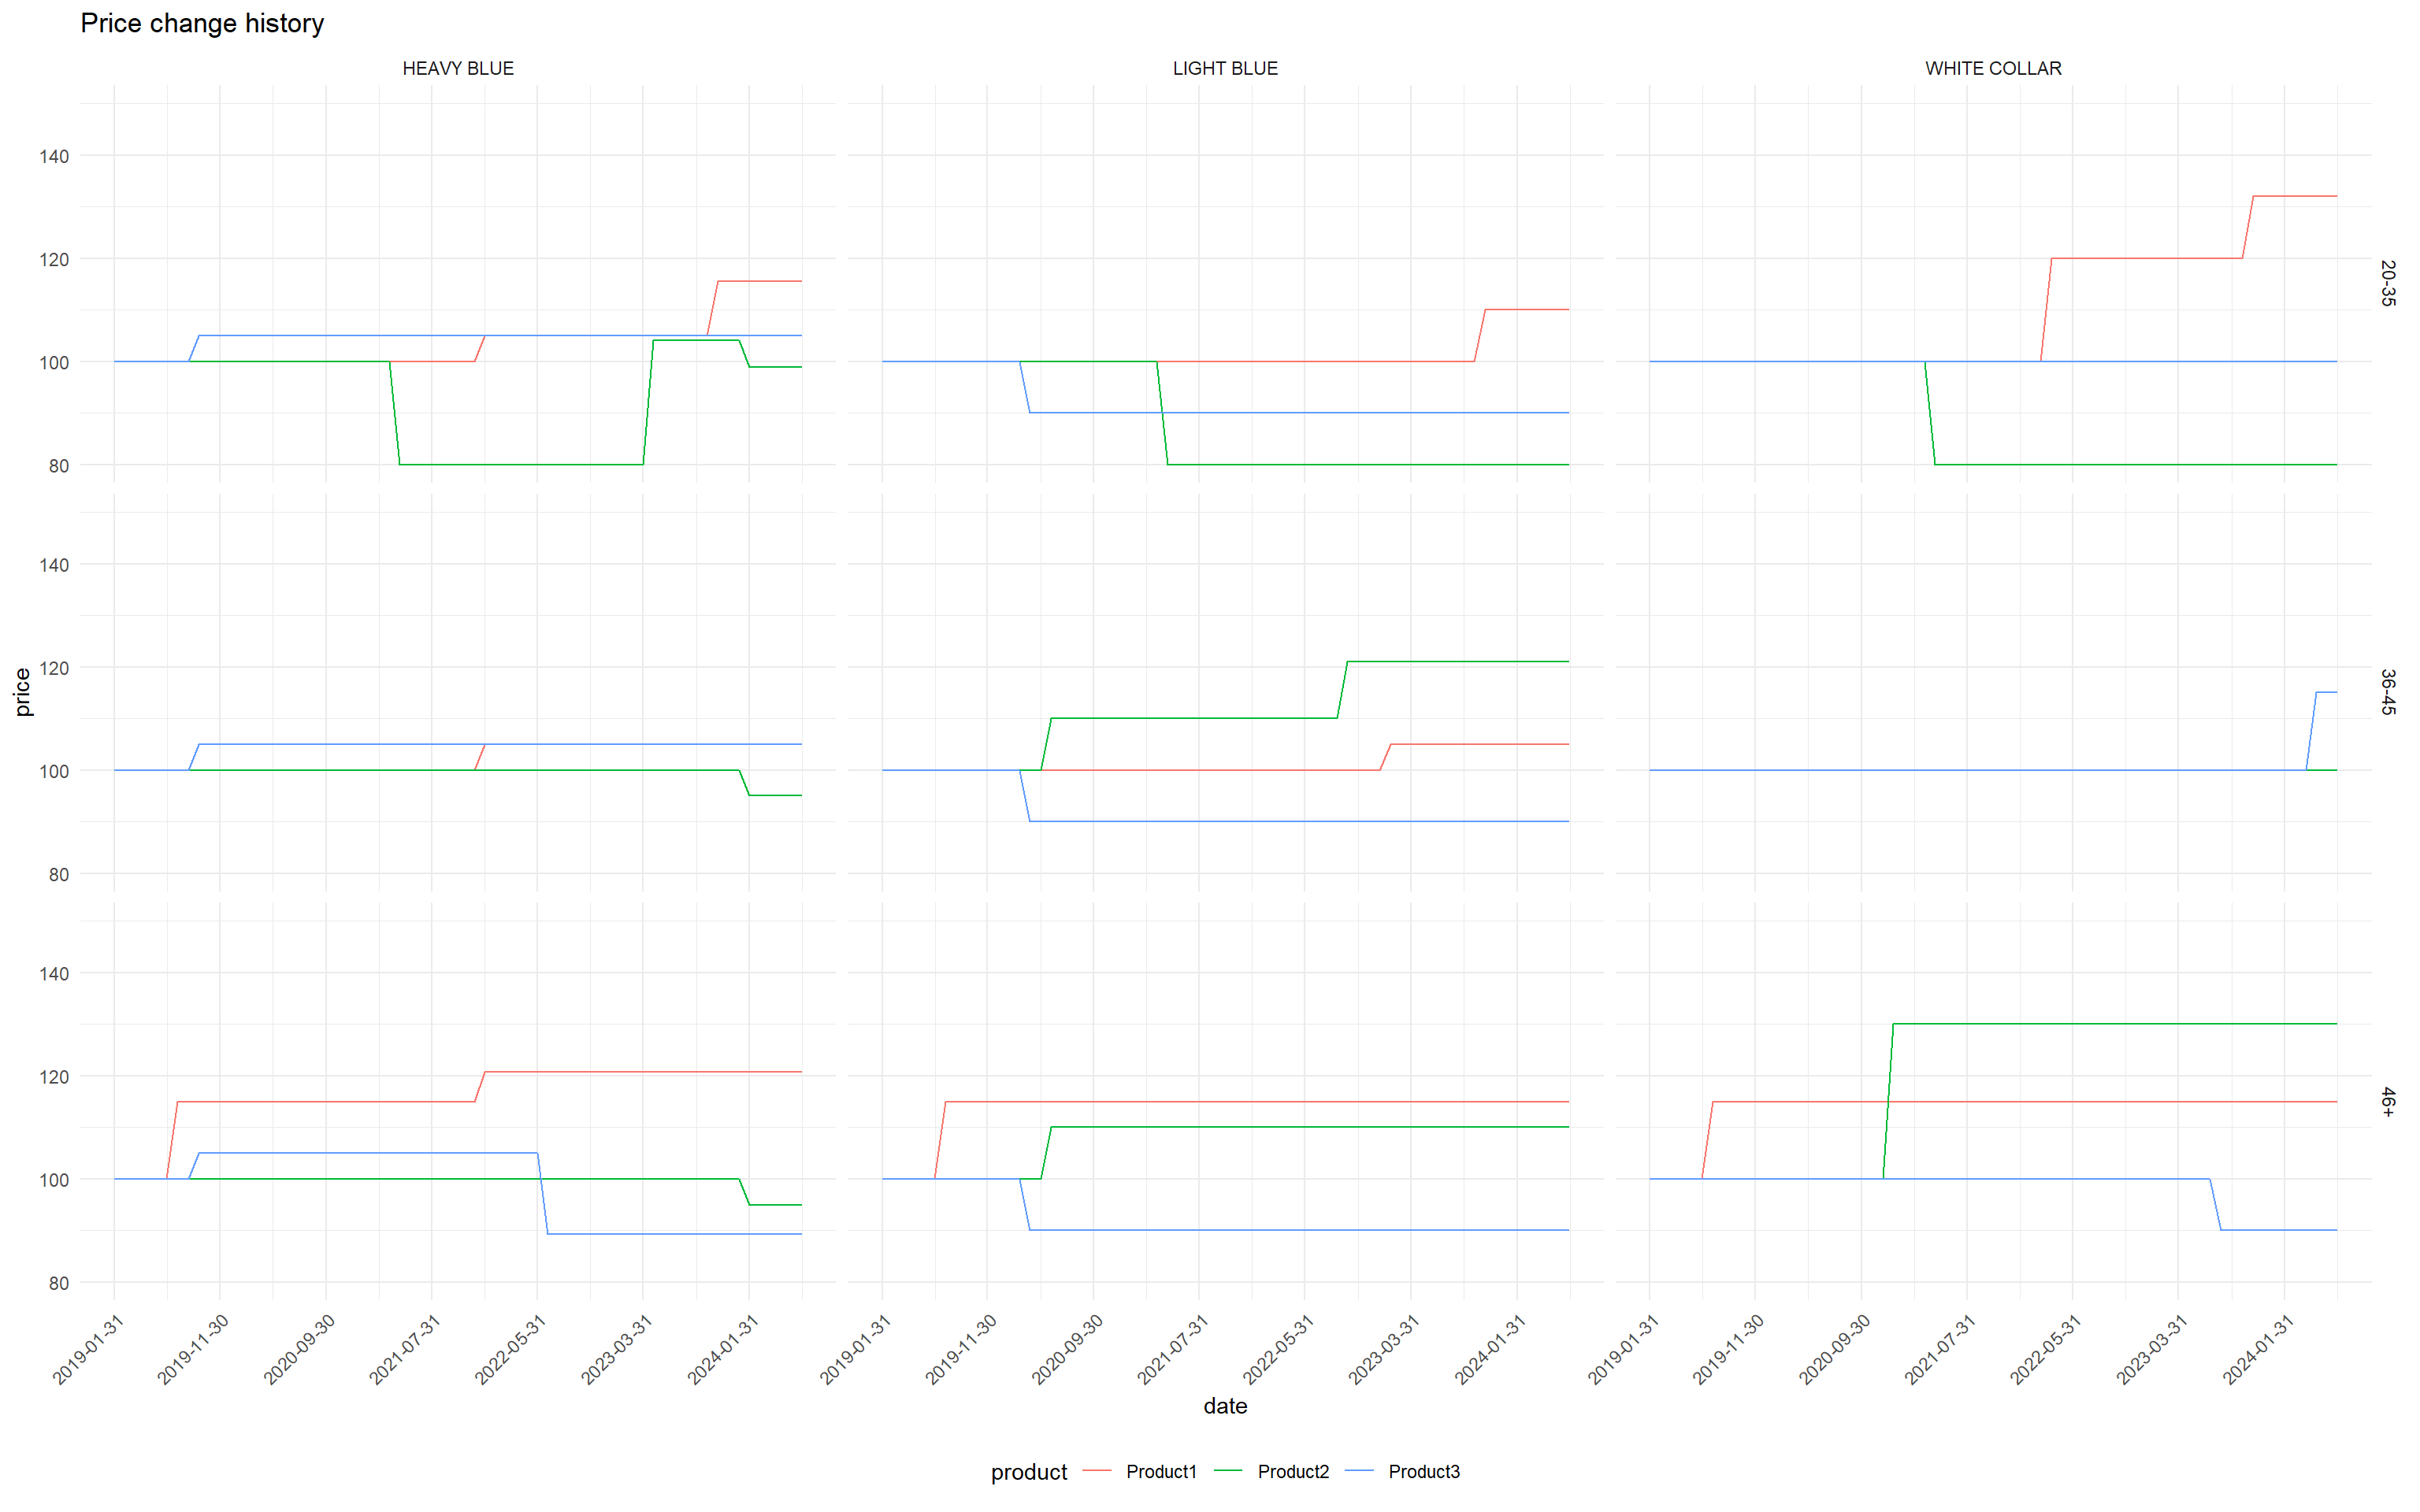
Exploring price elasticity
Price elasticity is the responsiveness of sales to changes in price. Initial exploration looking at demand/ recommendation modelling given price and other variables. Extendable to elasticity questions to help drive pricing strategies.
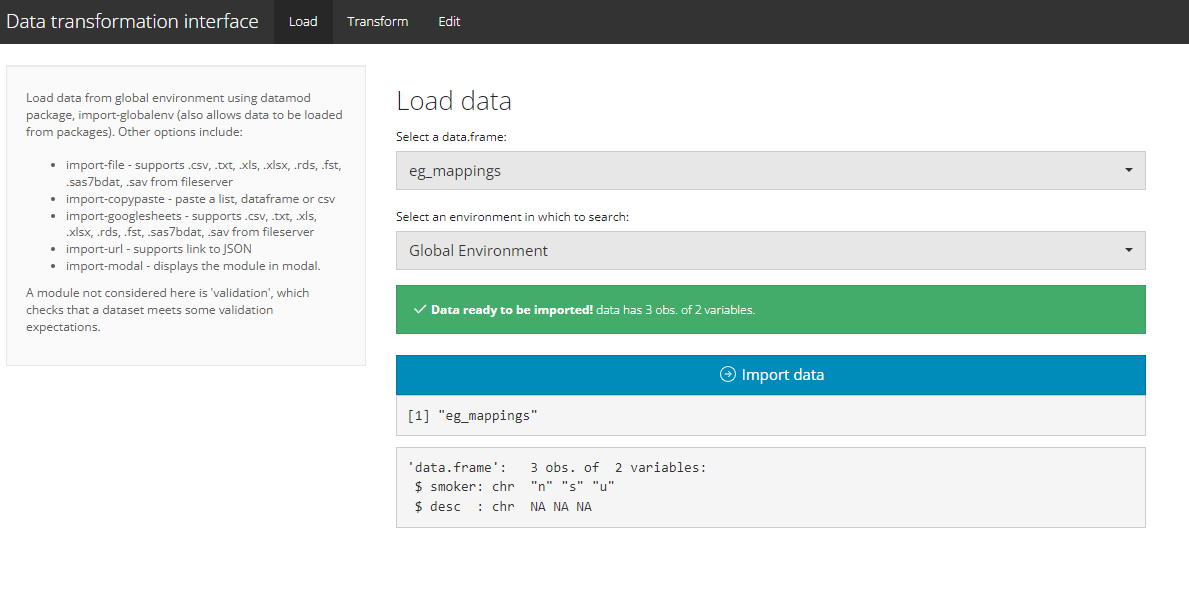
Transformation interface
Considering low-code interface solutions for simple data editing and transformation problems in R and Python.
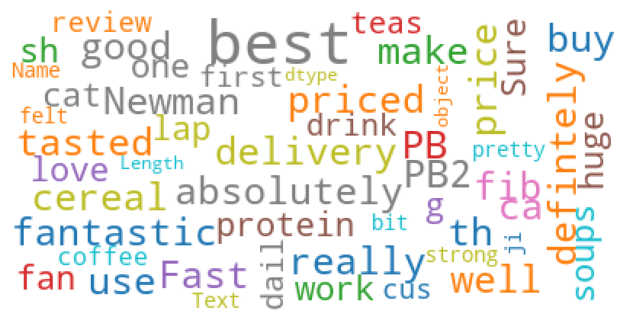
Exploring topic analysis
Classifying text data into multiple topics with a view to extracting primary and secondary topics, amongst other applications. Could be extended to claim cause classification problems in (life) insurance.
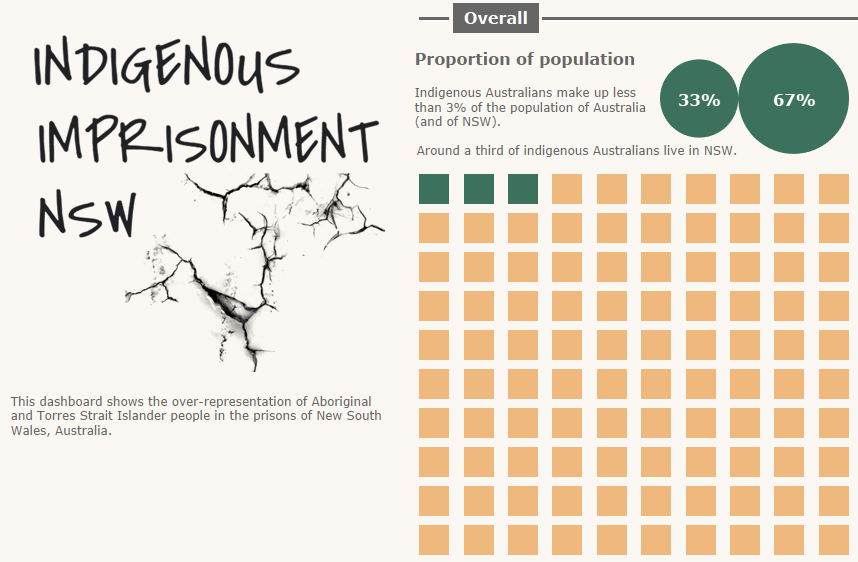
Indigenous over-representation in the prisons of NSW
A dashboard showing the over-representation of Aboriginal and Torres Straight Islander people in the prisons of New South Wales, Australia. Includes recipes for waffle and Coxcomb variations on the conventional pie chart.
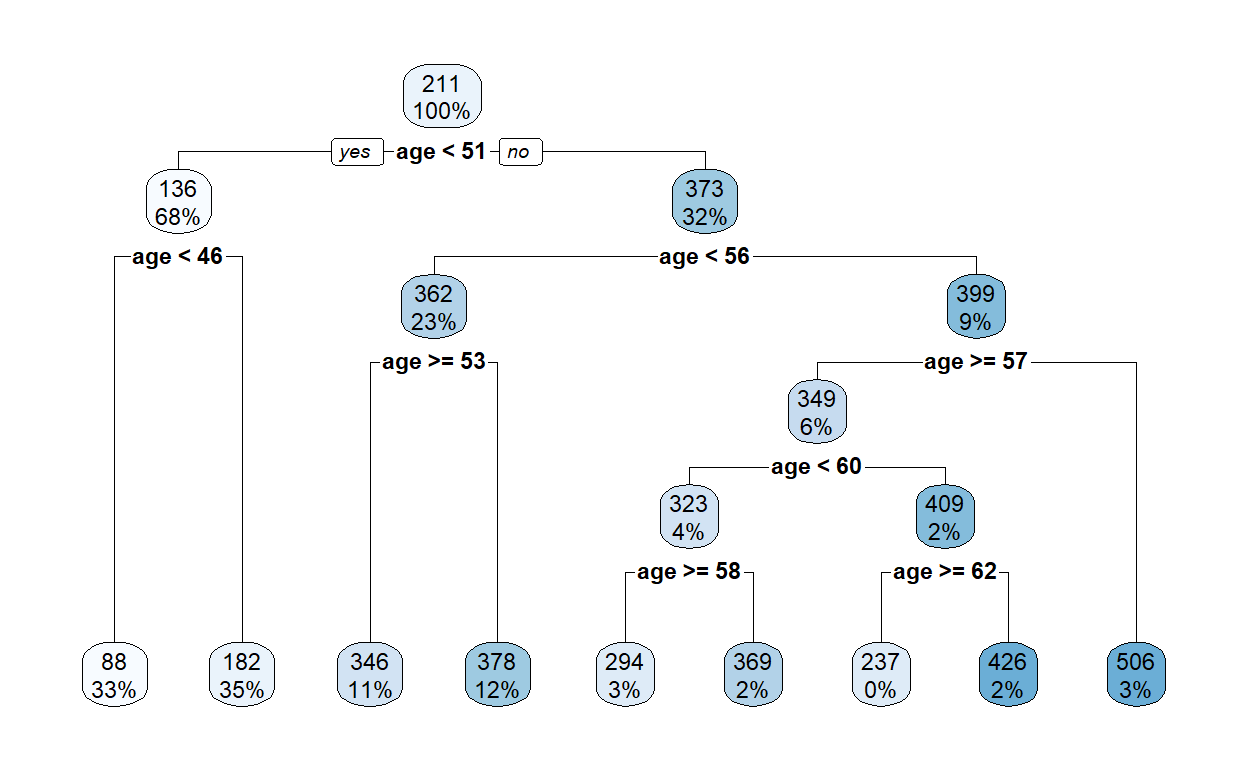
Decision trees
A brief into to decision tree classification techniques with a few simple worked examples using (life) insurance data on disability income.
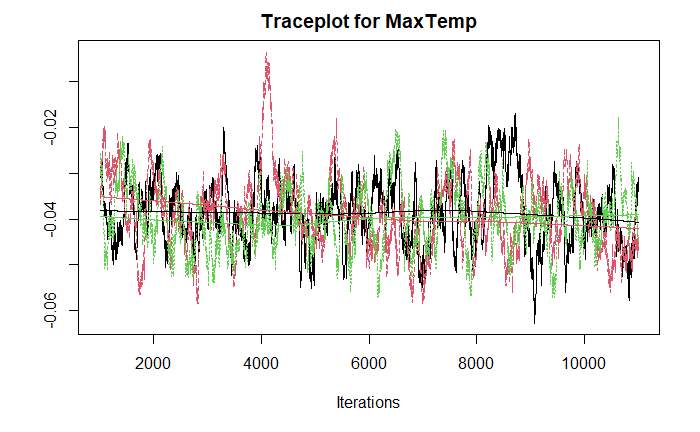
Bayesian applications
A quick Bayesian refresher, an extention to regression models and other applications.
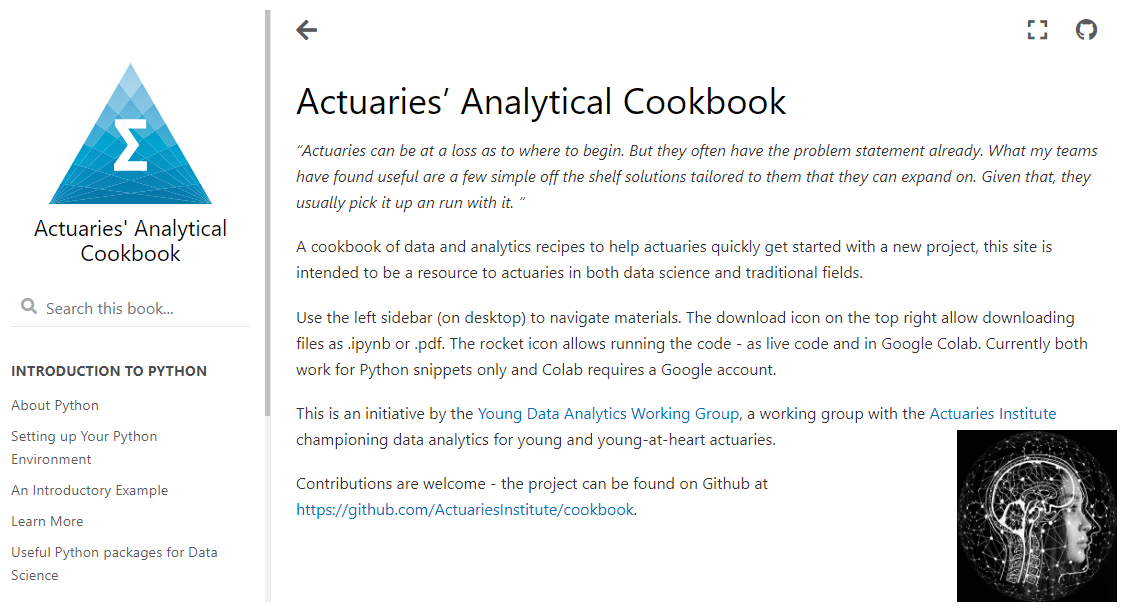
Actuaries Institute Cookbook
I have collaborated with members of the Actuaries Institute of Australia on this 'Actuaries Analytical Cookbook'. It spawned from the idea of sharing recipes to help actuaries and data scientists get started quickly on new projects.
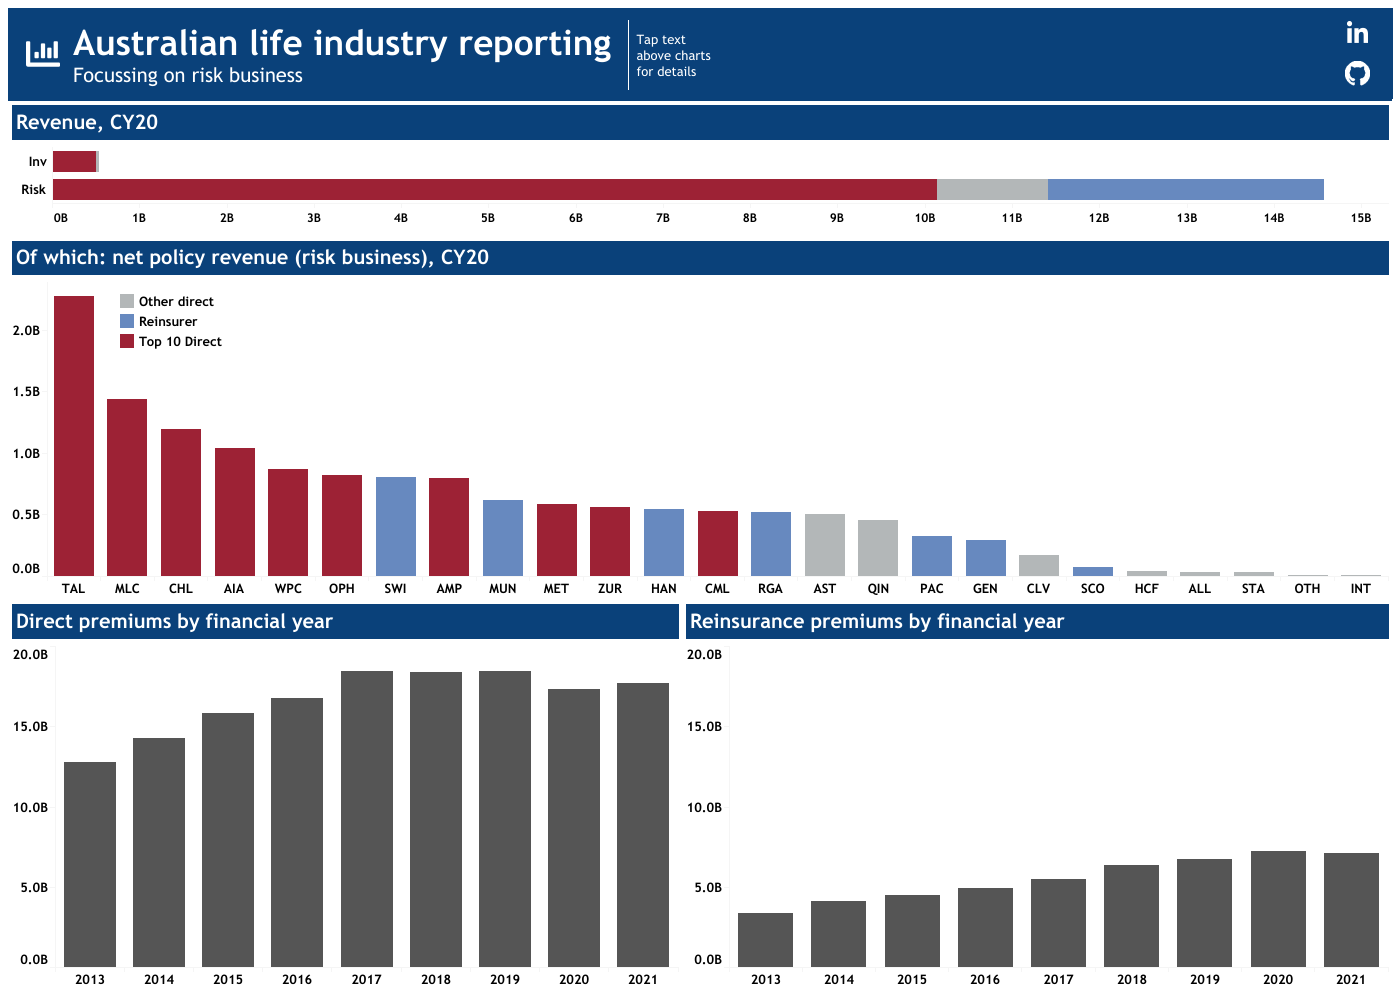
Life industry stats
This article sets out a simple recipe for visualising Australian life industry data from APRA using Tableau.
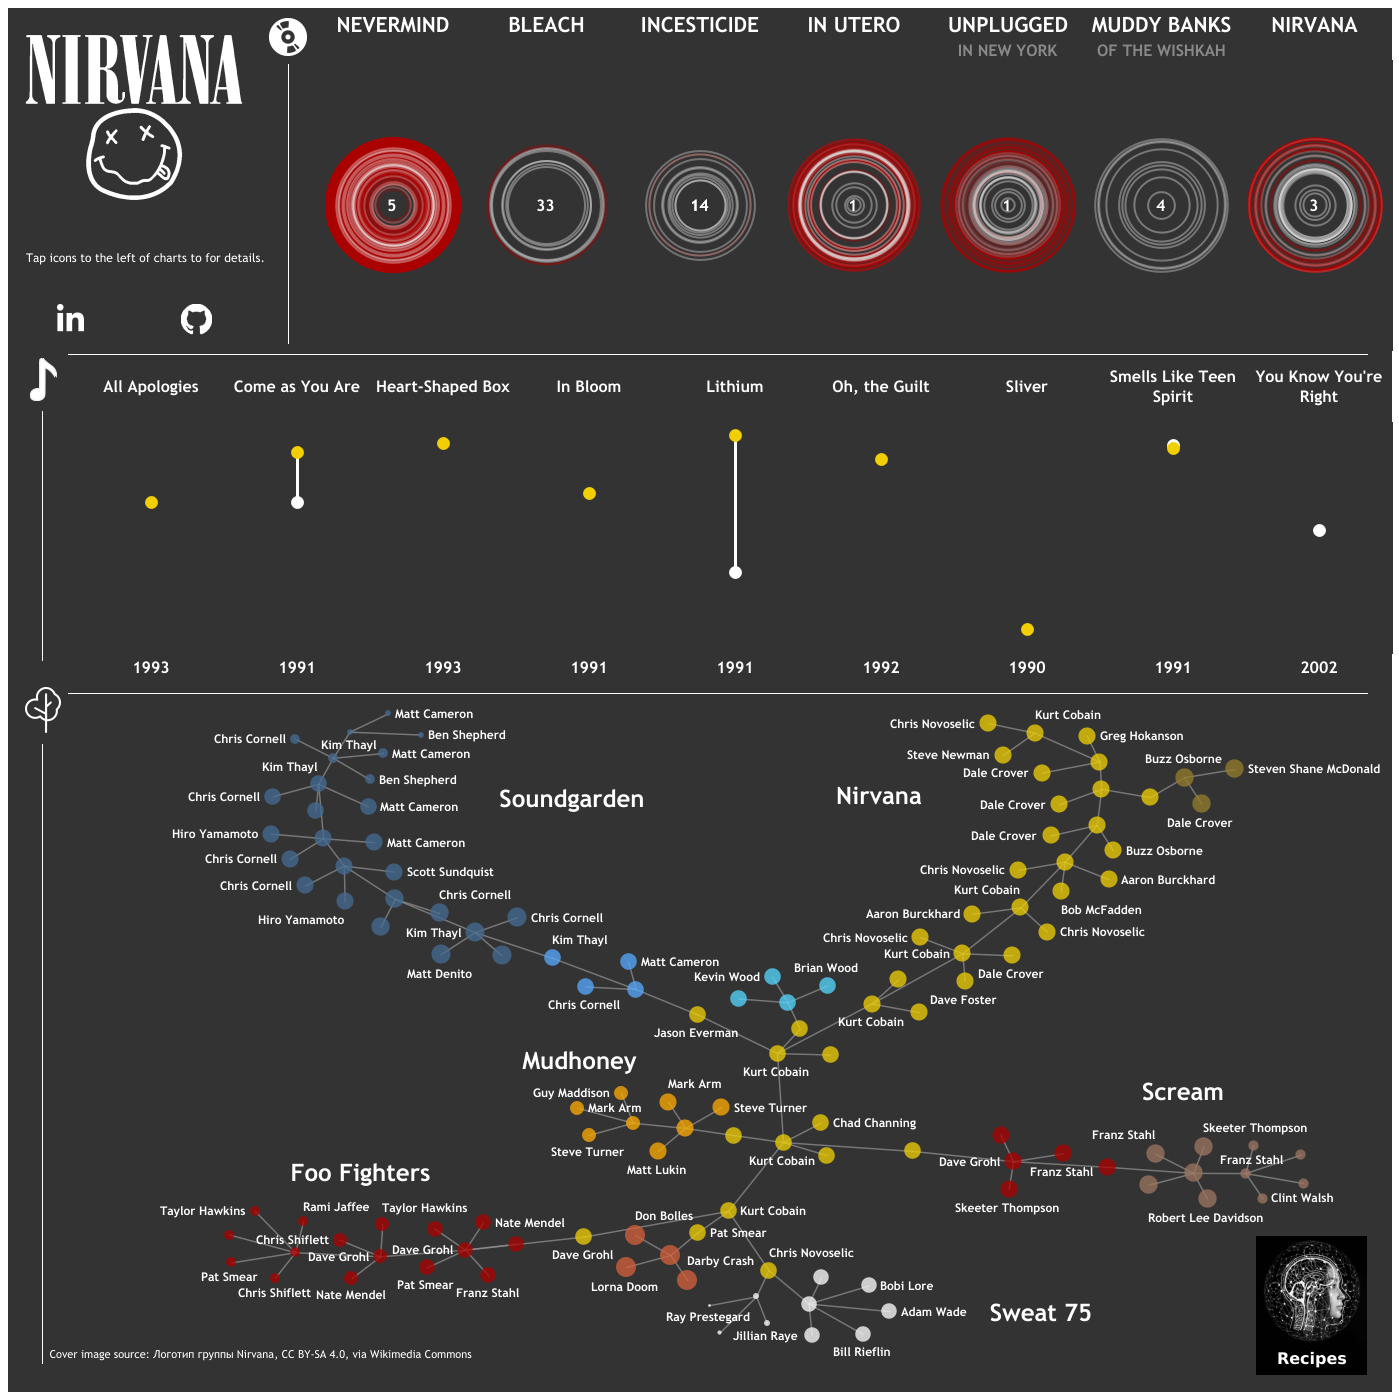
Network graphs
This article sets out a simple recipe for visualising a network using Tableau and Gephi. The example used is the network of bands and band members interconnected with Nirvana.
Regression modelling
This article sets out a few practical recipes for modelling with (life) insurance data. Insurance events are typically of low probability - these recipes consider some of the limitations of "small data" model fitting (where the observations of interest are sparse) and other topics for insurance like comparisons to standard tables.
Data transformations
This article sets out a few practical recipes for data transformations with (life) insurance data.